
Ultrasound radiomics in breast neoadjuvant therapy
A deterministic pipeline built by an AI agent from a written specification, with archived full texts, matched comparisons and visible source uncertainties. It separates absolute performance from incremental value, keeps RECIST response, major histological response and pCR distinct, and labels every metric by dataset and imaging-timepoint role.
Agentic workflow
An evidence synthesis collects the results of several published studies and asks what they say together. Doing this by hand is slow and hard to audit. Here an AI agent did the reading and wrote the code, but the code it produced runs without any AI: it reads saved copies of the articles, applies documented rules and always gives the same answer. Each step below has one job, and every number can be traced back to the sentence or table it came from.
AI agents selected the studies, wrote the specification and built the pipeline under my direction. The building agent read the four studies, documented the extractions and implemented the checks, following the written specification (AGENTS.md). The pipeline it produced is deterministic and offline: it uses no LLM or API at runtime, so the same inputs always regenerate the same scores, deltas and classifications.
Ingestion
The four prespecified full texts are archived locally (HTML, plus Wang Table 3, six supplements and Zhou Figure 5) and checked for DOI identity, completeness and SHA-256 hash at every run. No network access is needed to regenerate.
→ sources/ · inputs/source_manifest.jsonFactual extraction
Original tables are parsed directly; narrative facts come from curated transcriptions with indexed, hashed source passages. Every metric is tied to study, model, endpoint, dataset role and imaging-timepoint role. NR is never converted to zero.
→ src/extraction.py · inputs/reviewed_studies.jsonValidation
A second, independent HTML parser re-reads N, splits, endpoints, main AUCs, comparators and statistical tests. Disagreements and ambiguities become REVIEW_REQUIRED with reason, attempts and impact; the pipeline never picks a side.
→ src/validation.py → validation_checks.csvMethodological interpretation
Neutral considerations (single/multicenter, validation design, operator dependence, feature-selection nesting…) are recorded as observed, unclear, not reported or not applicable. No automatic risk labels.
→ methodological_considerations.csvComparability
Six study pairs × nine clinical criteria, judged semantically rather than lexically. Unavailable criteria are excluded from the denominator.
→ src/analysis.py → comparability_*.csvSynthesis freeze
The primary synthesis is frozen with hashes of inputs, AGENTS.md and modules before the benchmark is read. Earlier freezes are kept and never altered.
→ outputs/freezes/ · synthesis_frozen.jsonBenchmark
A 2024 meta-analysis is consulted only after the freeze, isolated from extraction, and never used to change conclusions.
→ benchmark/ → benchmark_comparison.mdReporting
CSVs, figures, report and notebook are built from the same derived results, and tests check that they agree.
→ src/report.py · src/plots.pyEvery second-pass check carries one of four labels:
| Label | Meaning |
|---|---|
| MATCH | The number is confirmed by an independent read of labelled columns or a calculation on explicit counts. |
| SOURCE_BOUND | The source passage is preserved and the narrative mapping was curated during construction. It does not mean an algorithm verified the clinical interpretation. |
| NOT_REPORTED | Not explicitly reported; kept as missing, never zero. |
| REVIEW_REQUIRED | Conflict, ambiguous association or missing critical value, with reason and impact. |
Research question
Neoadjuvant therapy is chemotherapy (sometimes with targeted drugs) given before breast surgery. Knowing early whether a tumour is responding helps doctors adjust treatment. Radiomics turns medical images into hundreds of quantitative features describing shape, brightness and texture, which a model can then use for prediction. The question is not whether radiomics models score well, but whether they add something beyond what doctors already know from clinical data and a standard ultrasound read.
Does ultrasound-based radiomics provide incremental predictive value for predicting response to neoadjuvant therapy in breast cancer beyond clinical and conventional ultrasound-based models?
Secondary question: how consistent is performance across imaging timepoints, radiomics strategies, model components and validation designs?
This is a proof of concept: four studies were prespecified, with no comprehensive search, screening or automatic meta-analysis.
Selected studies
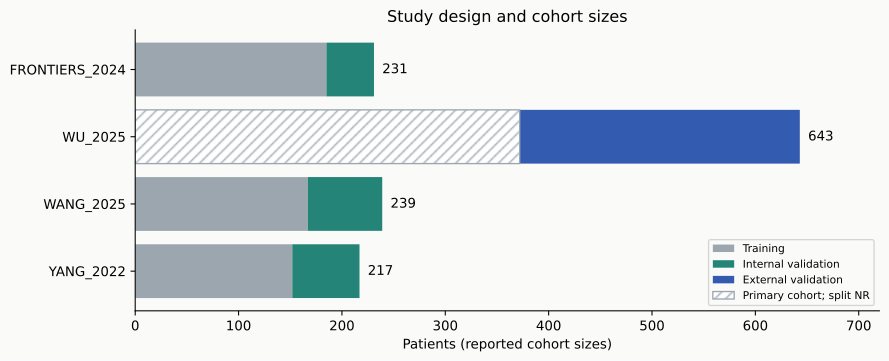
Four open-access studies were chosen in advance, so this is a demonstration of method rather than a full review of the literature. They differ in size, in how patients were split for model building and testing, and in whether the model was tested at a second hospital. The bars show how many patients each study used for training (building the model), internal validation (testing on held-out patients from the same hospital) and external validation (testing at a different hospital, the strongest check).
| Study | Authors | Year | N total | Train | Internal val. | External val. | Design |
|---|---|---|---|---|---|---|---|
| YANG_2022 | Yang et al. | 2022 | 217 | 152 | 65 | 0 | Retrospective |
| WANG_2025 | Wang et al. | 2025 | 239 | 167 | 72 | 0 | Retrospective |
| WU_2025 | Wu et al. | 2025 | 643 | NR | NR | 271 | Retrospective |
| FRONTIERS_2024 | Zhou et al. | 2024 | 231 | 185 | 46 | 0 | Retrospective |
Source access
A synthesis is only as reliable as its sources. Each article is stored locally and fingerprinted with a SHA-256 hash, a code that changes if even one character of the file changes. This means the pipeline can prove it is reading exactly the same documents on every run, and it can regenerate everything without an internet connection.
| Study | Source | DOI |
|---|---|---|
| YANG_2022 | Frontiers in Oncology · archived HTML | 10.3389/fonc.2022.748008 |
| WANG_2025 | BMC Cancer · archived HTML | 10.1186/s12885-025-14556-4 |
| WU_2025 | Frontiers in Oncology · archived HTML | 10.3389/fonc.2025.1525285 |
| FRONTIERS_2024 | Frontiers in Oncology · archived HTML | 10.3389/fonc.2024.1485681 |
All four primary full texts are archived and checked for DOI identity, document completeness and hash. Numerical table transcriptions are checked by an independent parser; narrative facts have reviewed source anchors. Exact source selectors are exported in the provenance table.
Clinical endpoint definitions
An endpoint is the outcome a model tries to predict. The four studies use three different ones. RECIST measures how much the tumour shrinks on imaging. Miller–Payne grades how many tumour cells are left under the microscope after surgery; grades 4–5 count as a major histological response (MHR). Pathological complete response (pCR) means no invasive cancer remains in the breast or lymph nodes. These are related but not interchangeable, so a model that predicts one well cannot be assumed to predict another.
The four studies use three different response targets. Binary coding is an analysis convenience and does not make them equivalent.
| Study | Endpoint | Definition | Comparable to pCR |
|---|---|---|---|
| YANG_2022 | RECIST responder / non-responder | At least 30% reduction in longest dimension on both US and MRI versus baseline | no |
| WANG_2025 | Miller–Payne MHR / non-MHR | Miller–Payne G4–G5 = major histological response; G1–G3 = non-major response | no |
| WU_2025 | pCR / non-pCR | Postoperative pCR; ypT0/is ypN0 stated in Introduction; operational adjudication not explicit in Methods | category yes; operational definition needs review |
| FRONTIERS_2024 | pCR / non-pCR | No residual invasive carcinoma, DCIS may remain; no ipsilateral sentinel/axillary node involvement | yes |
Imaging timepoints
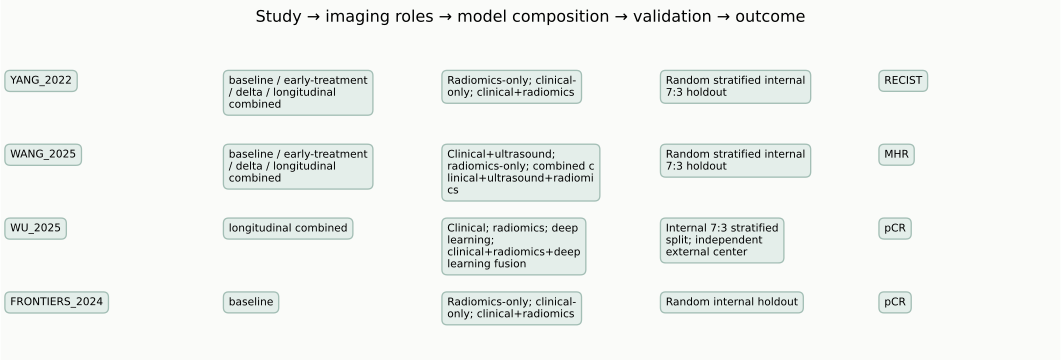
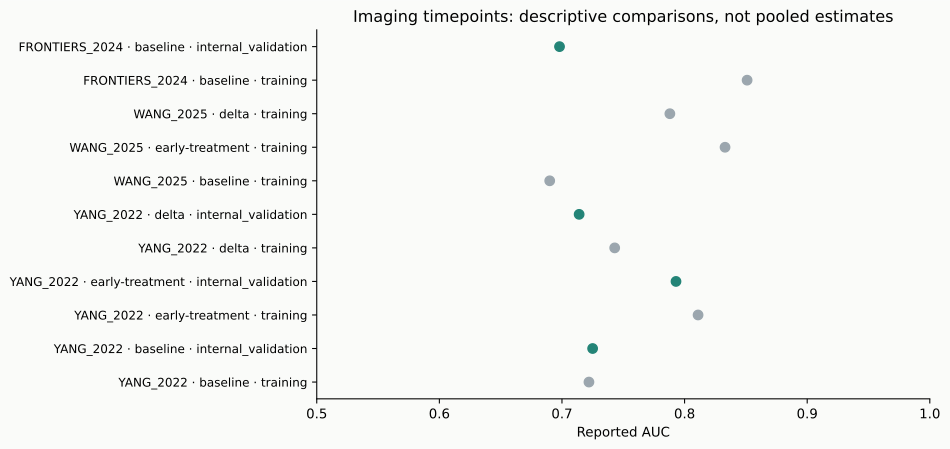
Ultrasound images can be taken before treatment (baseline), after the first cycles (early-treatment), or both. Delta radiomics measures how the features change between the two scans, and longitudinal models combine both timepoints. Later images contain more information about the response already under way, so comparing a baseline model with an early-treatment model is not a like-for-like comparison. The pipeline labels every result with its timepoint so these differences stay visible.
| Study | Timepoints reported | Model roles |
|---|---|---|
| YANG_2022 | Pretreatment and after 2 NAC cycles | baseline; early-treatment; delta; longitudinal combined |
| WANG_2025 | Baseline and after 2 NAT cycles | baseline; early-treatment; delta; longitudinal combined |
| WU_2025 | Pretreatment and midpoint of NAC | longitudinal combined |
| FRONTIERS_2024 | Pretreatment before NAC | baseline |
“Early” means after two cycles in Yang and Wang; Wu’s midpoint is not assumed to mean two cycles. Baseline, delta and longitudinal information are kept separate.
Evidence extraction
Extraction means reading each article and filling in a structured form: who was studied, how images were acquired and segmented (the tumour outlined on the image), which features and algorithms were used, and how models were tested. The form has 54 fields per study. When an article does not report something, the field is marked NR (not reported) instead of being guessed or set to zero, so gaps in the literature remain visible.
Each study is extracted against a 54-field schema covering design, population, reference standard, ultrasound acquisition, segmentation, radiomics, models and validation. Missing fields stay visible.
| Study | Fields present | Missing | Source-bound | Performance rows | Known AUCs |
|---|---|---|---|---|---|
| YANG_2022 | 44 / 54 | 10 | 53 | 8 | 8 |
| WANG_2025 | 41 / 54 | 13 | 47 | 9 | 6 |
| WU_2025 | 41 / 54 | 13 | 46 | 8 | 8 |
| FRONTIERS_2024 | 49 / 54 | 5 | 50 | 24 | 24 |
Performance comparison
The main performance measure is AUC (area under the ROC curve). It describes how well a model ranks responders above non-responders: 0.5 is a coin toss, 1.0 is perfect. The 95% confidence interval (CI) shows the range of plausible values given the sample size; wide intervals mean the estimate is uncertain. Training results usually look better than validation results because the model has already seen those patients, so the validation columns are the ones that matter most.
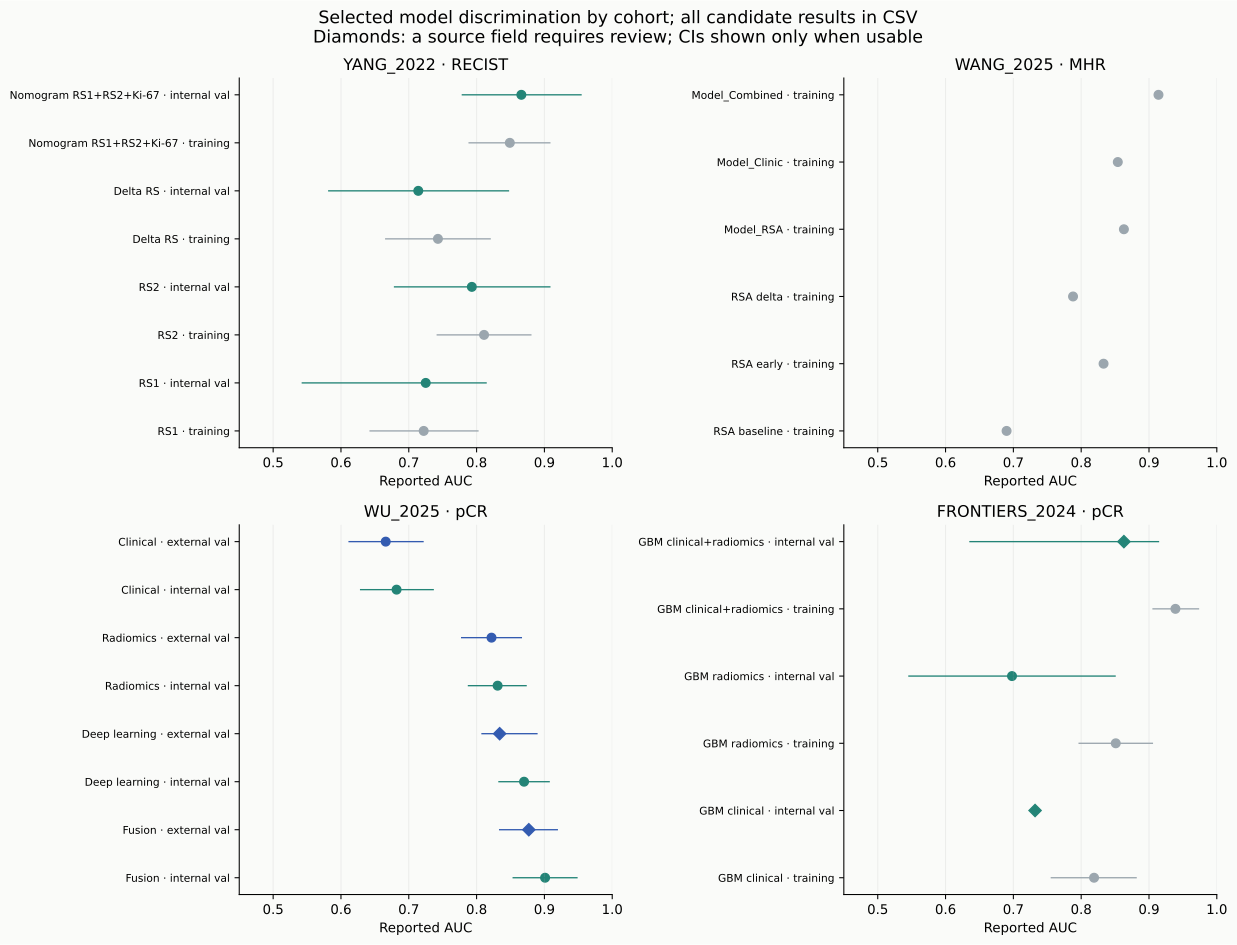
Reported AUC (95% CI) by model and dataset role. Values marked “review” are provisional transcriptions with an open source discrepancy.
| Study | Model | Type | Timepoint | Training | Internal val. | External val. |
|---|---|---|---|---|---|---|
| YANG_2022 | RS1 | radiomics-only | baseline | 0.722 (0.643–0.802) | 0.725 (0.543–0.814) | — |
| YANG_2022 | RS2 | radiomics-only | early-treatment | 0.811 (0.742–0.880) | 0.793 (0.679–0.908) | — |
| YANG_2022 | Delta RS | radiomics-only | delta | 0.743 (0.666–0.820) | 0.714 (0.582–0.847) | — |
| YANG_2022 | Nomogram RS1+RS2+Ki-67 | clinical+radiomics | longitudinal | 0.849 (0.789–0.908) | 0.866 (0.779–0.954) | — |
| WANG_2025 | RSA baseline | radiomics-only | baseline | 0.690 | — | — |
| WANG_2025 | RSA early | radiomics-only | early-treatment | 0.833 | — | — |
| WANG_2025 | RSA delta | radiomics-only | delta | 0.788 | — | — |
| WANG_2025 | Model_RSA | radiomics-only | longitudinal | 0.863 | NR · review | — |
| WANG_2025 | Model_Clinic | clinical+ultrasound | baseline | 0.854 | NR · review | — |
| WANG_2025 | Model_Combined | clinical+US+radiomics | longitudinal | 0.914 | NR · review | — |
| WU_2025 | Clinical | clinical-only | baseline | — | 0.682 (0.629–0.736) | 0.666 (0.612–0.721) |
| WU_2025 | Radiomics | radiomics-only | longitudinal | — | 0.831 (0.788–0.873) | 0.822 (0.778–0.866) |
| WU_2025 | Deep learning | deep learning | longitudinal | — | 0.870 (0.833–0.907) | 0.834 (0.808–0.889) · review |
| WU_2025 | Fusion | clinical+radiomics+DL | longitudinal | — | 0.901 (0.854–0.948) | 0.877 (0.834–0.919) · review |
| FRONTIERS_2024 | GBM clinical | clinical-only | baseline | 0.819 (0.756–0.881) | 0.732 · CI unusable | — |
| FRONTIERS_2024 | GBM radiomics | radiomics-only | baseline | 0.851 (0.797–0.905) | 0.698 (0.546–0.850) | — |
| FRONTIERS_2024 | GBM clinical+radiomics | clinical+radiomics | baseline | 0.939 (0.906–0.973) | 0.863 (0.636–0.914) · review | — |
Zhou 2024 also reports nine additional radiomics-only algorithms (LR, NB, SVM, KNN, RF, ET, LGBM, AdaBoost, MLP); their internal-validation AUCs range from 0.447 to 0.694. All rows, with sensitivity, specificity, calibration and provenance, are in the full report.
Incremental value
Incremental value asks whether adding radiomics improves on a simpler model, for example clinical data alone. ΔAUC is the difference between two models’ AUCs on the same patients. A positive ΔAUC is not proof by itself: the difference could be due to chance. The DeLong test is the standard statistical test for comparing two AUCs measured on the same patients, and a low p-value (typically below 0.05) suggests the difference is real. Each comparison is classified according to how strong the supporting evidence is.
Seven comparison families are searched in every study: (A) radiomics vs clinical-only, (B) radiomics vs conventional ultrasound, (C) combined vs clinical, (D) early vs baseline, (E) delta vs baseline, (F) radiomics+deep learning vs radiomics-only, (G) fusion vs components. Equivalent contrasts prioritise external validation → internal validation → test → training.
| Class | Rule |
|---|---|
| Demonstrated | Improvement on the same validation/test set, supported by a direct, appropriate and verified statistical comparison. |
| Suggestive | Numerical improvement on the same validation/test set; significance not verified. |
| Not demonstrated | No improvement, or a direct test that is not significant. This does not prove equivalence. |
| Indeterminate | Comparison absent, not isolable, incompatible or training-only. |
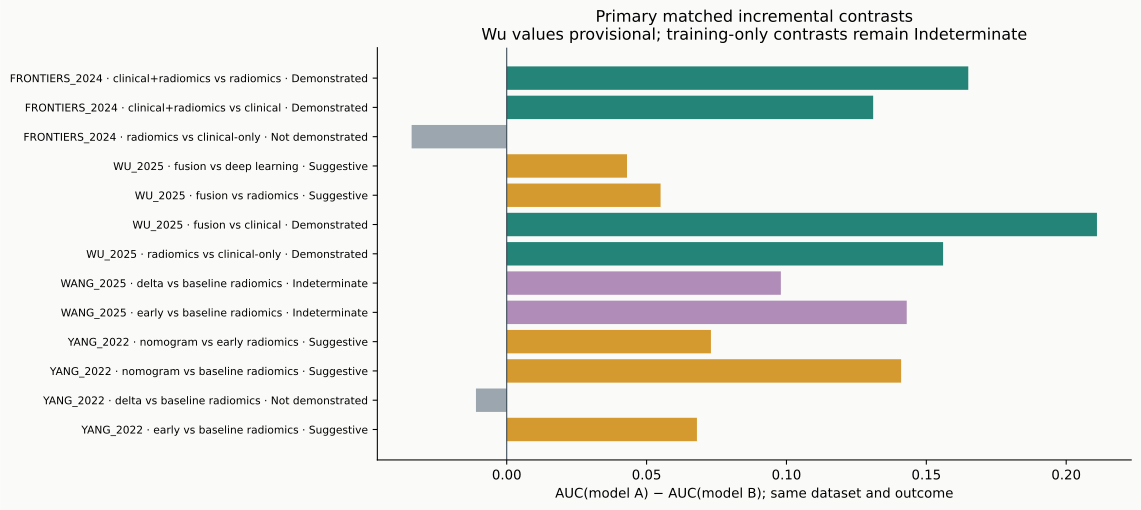
| Study | Comparison | Dataset | AUC A vs B | ΔAUC | Test | Classification |
|---|---|---|---|---|---|---|
| WU_2025 | A · radiomics vs clinical-only | external val. | 0.822 vs 0.666 | 0.156 | DeLong p=0.029 | Demonstrated |
| WU_2025 | G · fusion vs clinical | external val. | 0.877 vs 0.666 | 0.211 | DeLong p=0.003 | Demonstrated |
| WU_2025 | G · fusion vs radiomics | external val. | 0.877 vs 0.822 | 0.055 | NR | Suggestive |
| WU_2025 | G · fusion vs deep learning | external val. | 0.877 vs 0.834 | 0.043 | NR | Suggestive |
| FRONTIERS_2024 | C · clinical+radiomics vs clinical | internal val. | 0.863 vs 0.732 | 0.131 | DeLong p=0.01 | Demonstrated |
| FRONTIERS_2024 | G · clinical+radiomics vs radiomics | internal val. | 0.863 vs 0.698 | 0.165 | DeLong p=0.005 | Demonstrated |
| FRONTIERS_2024 | A · radiomics vs clinical-only | internal val. | 0.698 vs 0.732 | −0.034 | NR | Not demonstrated |
| YANG_2022 | D · early vs baseline radiomics | internal val. | 0.793 vs 0.725 | 0.068 | NR | Suggestive |
| YANG_2022 | E · delta vs baseline radiomics | internal val. | 0.714 vs 0.725 | −0.011 | NR | Not demonstrated |
| YANG_2022 | G · nomogram vs baseline radiomics | internal val. | 0.866 vs 0.725 | 0.141 | NR | Suggestive |
| YANG_2022 | G · nomogram vs early radiomics | internal val. | 0.866 vs 0.793 | 0.073 | NR | Suggestive |
| WANG_2025 | C · combined vs clinical+ultrasound | internal val. | NR | NR | NR | Indeterminate |
| WANG_2025 | G · combined vs radiomics | internal val. | NR | NR | NR | Indeterminate |
| WANG_2025 | D · early vs baseline radiomics | training | 0.833 vs 0.690 | 0.143 | NR | Indeterminate |
| WANG_2025 | E · delta vs baseline radiomics | training | 0.788 vs 0.690 | 0.098 | NR | Indeterminate |
Primary matched contrasts: 4 Demonstrated, 5 Suggestive, 2 Not demonstrated, 4 Indeterminate. Contrasts within a study are correlated and are not independent study counts. Families without an isolated, source-supported contrast (e.g. B and F in every study) are Indeterminate.
Methodological considerations
Study design affects how much a result can be trusted. Single-centre studies with one scanner may not generalise to other hospitals. Manual tumour outlining depends on the operator. Feature selection done before splitting the data can let information from test patients leak into the model and inflate performance. Rather than labelling studies “high” or “low risk”, the pipeline records what each article does or does not report, so readers can judge for themselves.
Considerations are recorded neutrally as observed, unclear, not reported or not applicable. The pipeline does not assign automatic “high risk” judgements.
| Consideration | YANG_2022 | WANG_2025 | WU_2025 | FRONTIERS_2024 |
|---|---|---|---|---|
| Single / multicenter | observedSingle center | observedSingle center | observedTwo institutions | observedSingle center |
| Validation design | observedInternal 7:3 holdout | observedInternal 7:3 holdout | observedInternal 7:3 + external center | observedInternal holdout |
| Class balance | observed58.5% responders | unclear51.5% MHR, counts not explicit | observed39.3% pCR | observed42.4% pCR |
| Acquisition | observedOne scanner (GE Logiq E9) | observedSiemens ABVS; follow-up also Philips | observedFour vendors | observedGE and Philips |
| Operator dependence | observedManual 2D ROI, one reader | observedU-Net + manual correction | observedManual 2D, two readers | observedManual 2D, two readers |
| Missing data | unclearIncomplete cases excluded | unclearIncomplete cases excluded | unclearIncomplete cases excluded | unclearIncomplete cases excluded |
| Feature selection inside validation | unclearNesting not established | unclearNesting not established | unclearNesting not established | unclearNesting not established |
| External generalization | not applicableNo external cohort | not applicableNo external cohort | observedIndependent external center | not applicableNo external cohort |
Cross-study comparability
Before results from different studies can be combined, they need to be measuring the same thing in similar patients. Each pair of studies is compared on nine criteria, such as endpoint, treatment, imaging timing and validation design. Each criterion is scored aligned, partially aligned or not aligned, and criteria that cannot be judged because information is missing are left out rather than counted against the pair. The score summarises similarity; it is not by itself permission to pool.
Nine criteria per pair: endpoint definition, regimen, timepoint, imaging modality, radiomics strategy, comparator, validation, population, subtype. aligned = 1, partially aligned = 0.5, not aligned = 0; unavailable criteria are excluded from the denominator. High ≥ 0.75, moderate ≥ 0.50, low < 0.50. Scores describe alignment and do not establish poolability.
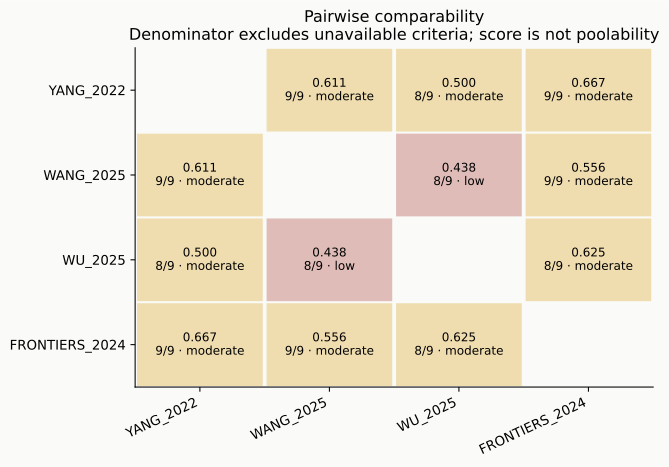
| Pair | Score | Evaluated | Rating | Main reason |
|---|---|---|---|---|
| YANG_2022 · WANG_2025 | 0.611 | 9 / 9 | moderate | Different targets: RECIST versus MHR. |
| YANG_2022 · WU_2025 | 0.500 | 8 / 9 | moderate | RECIST versus pCR; Wu regimen not reported. |
| YANG_2022 · FRONTIERS_2024 | 0.667 | 9 / 9 | moderate | Different targets: RECIST versus pCR. |
| WANG_2025 · WU_2025 | 0.438 | 8 / 9 | low | MHR versus pCR; Wu regimen not reported. |
| WANG_2025 · FRONTIERS_2024 | 0.556 | 9 / 9 | moderate | Different targets: MHR versus pCR. |
| WU_2025 · FRONTIERS_2024 | 0.625 | 8 / 9 | moderate | pCR aligned; timepoints, model composition and validation differ; regimen unavailable. |
Populations are partially aligned across all pairs: every study includes breast cancer patients receiving NAC, with differences in eligibility, completion and surgery requirements. Subtypes are partially aligned: all include hormone-receptor, HER2 and triple-negative categories, with distributions that differ or are incompletely reliable.
Poolability decision
Pooling means statistically combining results from several studies into one estimate, as in a meta-analysis, usually shown as a forest plot. It only makes sense when studies predict the same outcome, with the same kind of model, at the same imaging timepoint, tested in the same way. The pipeline checks whether at least two independent studies share all of these features. If none do, no pooled estimate is produced, because a single number would hide real differences.
No joint stratum contains two independent studies with the same endpoint, imaging role, model composition and validation role. The only pCR pair (Wu and Zhou) compares baseline radiomics against pre+midpoint radiomics, and its operational pathology definition and source precision also need review. Strata were checked separately for baseline, early-treatment, delta and pCR studies; each contains a single study.
No forest plot or quantitative meta-analysis was generated.
Final synthesis
This is the summary the pipeline “froze” before looking at any external review. Freezing means the conclusions were saved with a fingerprint, so they cannot be quietly adjusted later to match someone else’s findings. Each point is limited to what the four studies actually support.
- —Four prespecified studies; three endpoint categories (RECIST, Miller–Payne MHR, pCR). Not an exhaustive systematic review.
- —Zhou 2024 provides a direct clinical+radiomics versus clinical-only contrast on baseline imaging, supported by a verified DeLong test (Figure 5H), within one small internal validation cohort.
- —Wu 2025 validates multimodal models on an external center, but longitudinal information, clinical and deep features complicate attribution to radiomics alone; table/prose discrepancies leave effect sizes provisional.
- —Wang 2025: exact validation AUCs and the dataset attribution of its tests remain unresolved, so validation incremental value is Indeterminate.
- —Yang 2022 separates early and delta from baseline radiomics; training tests are not borrowed for validation contrasts.
- —18 REVIEW_REQUIRED checks remain visible. Clinical usefulness beyond discrimination is not established by AUC differences alone.
Open source questions
Published articles sometimes contradict themselves, for example when a number in the abstract differs from the same number in a table. The pipeline does not choose a version on its own. It records both, explains which results depend on the value, and flags the item as REVIEW_REQUIRED for a human to check. Making this list visible is part of the result: it shows where the evidence is less certain than it first appears.
Unresolved discrepancies between sections of the same article are kept with both versions, the impact on the analysis, and the number of resolution attempts (stopped after two when no new evidence emerged).
| Study | Field | Discrepancy | Impact |
|---|---|---|---|
| YANG_2022 | Recruitment period | Abstract starts January 2018; Methods December 2018. | Provenance only; no effect on AUCs. |
| YANG_2022 | Prevalence | Results says 62.5% / 37.5%; counts and abstract support 58.5% / 41.5%. | Prevalence calculated from counts. |
| YANG_2022 | Nomogram specificity (val.) | Table 3 says 0.789; Results prose 0.798. | Table value provisional. |
| YANG_2022 | Nomogram tests | p<0.001 vs RS1 and p=0.376 vs RS2 without clear dataset allocation. | Not transferred to validation. |
| WANG_2025 | Validation AUCs (×3 models) | Not tabulated; combined only “approximately 0.90”. | Validation incremental value Indeterminate. |
| WANG_2025 | Validation AUC summary | Approximate value not converted to an exact estimate. | Same as above. |
| WANG_2025 | Comparison tests | Abstract assigns p=.006/.042 to validation; Table 3 pairs them with training AUCs. | No Demonstrated validation claim. |
| WANG_2025 | Responder N | 51.5% overall, but Table S1 gives MHR=90 / NMHR=77 in training only. | No counts inferred from rounding. |
| WU_2025 | Fusion AUC (external) | Table 2: 0.877; abstract/results: 0.891. | Fusion effect sizes provisional. |
| WU_2025 | Deep learning AUC (external) | Table 2: 0.834; abstract/results: 0.874. | Fusion − DL is 0.043 vs 0.003 depending on source. |
| WU_2025 | pCR definition | ypT0/is ypN0 only in Introduction; operational criterion absent in Methods. | Needs review before any pooling. |
| WU_2025 | Initial features | Abstract 2920; Methods 1216 per ROI and 2438 per patient (2×1216=2432). | Feature counts unresolved. |
| WU_2025 | Subtype counts | Table 1 subtypes sum to 352, not 372. | Distributions not trusted. |
| WU_2025 | Train / internal N | 372 split 7:3; exact integers not reported. | No invented split. |
| FRONTIERS_2024 | GBM clinical CI (val.) | Figure 5B prints AUC 0.732 with CI 0.758–0.968, excluding the estimate. | CI left unusable. |
| FRONTIERS_2024 | Recall vs sensitivity | Table 5 sensitivity 0.750 and recall 0.850 for the same model. | Both kept; no confusion matrix inferred. |
Benchmark comparison
A benchmark is an independent reference to compare against. Here it is a 2024 systematic review with meta-analysis on the same topic. It was read only after the synthesis was frozen, to avoid being influenced by it. Sensitivity is the share of true responders a test correctly identifies; specificity is the share of non-responders correctly identified. RQS (Radiomics Quality Score) is a checklist that rates the methodological quality of radiomics studies.
Benchmark: Ultrasound-based radiomics for early predicting response to neoadjuvant chemotherapy in patients with breast cancer: a systematic review with meta-analysis (2024; DOI 10.1007/s11547-024-01783-1; PMID 38630147). Only the publisher abstract and preview were accessible.
The review searched four databases through 1 January 2023 and included eight studies. Mean RQS was 12.88 (35.8% of the maximum). Pooled sensitivity was 0.87 (95% CI 0.81–0.92) and specificity 0.78 (0.72–0.83). The authors describe potential predictive usefulness and call for rigorous multicenter prospective confirmation.
The review predates the two 2025 studies and reports pooled accuracy, not a pooled incremental contrast against clinical or conventional ultrasound models. Its findings support cautious interpretation of combined-model performance and do not change the primary synthesis.
Limitations of the AI pipeline
Automation makes analysis faster and repeatable, but it does not replace expert judgement. This section lists what the pipeline cannot do, so its results are read with the right level of confidence. The commands at the bottom regenerate every output from the saved sources.
- —Four protocol-selected studies; no exhaustive search or screening.
- —Narrative transcriptions and semantic mappings were curated by the building agent. Deterministic source checks do not replace independent clinical appraisal.
- —Source contradictions, missing exact validation metrics and uncertain feature-selection nesting remain open.
- —No patient data, model fitting, invented confidence intervals or imputed confusion matrices.
- —Previous benchmark exposure prevents a claim of blind synthesis.
- —The workflow reproduces reviewed transcriptions, interpretations and calculations. It is not a general autonomous extractor for new articles, and repeated execution cannot repair source contradictions.
Regenerate from the project folder with the existing virtual environment: