
Radiomics from ovarian ultrasound: research demonstration
A reproducible radiomics-to-ML workflow on MMOTU ovarian ultrasound images, with leakage-safe preprocessing, model comparison, calibration and an exact-duplicate image audit.
Research question
Ovarian masses seen on ultrasound range from harmless cysts to cancer, and telling them apart can be difficult. Radiomics turns images into hundreds of numbers describing shape, brightness and texture, which a model can use for classification. This project tests whether such features can separate eight types of ovarian findings in a public dataset, as a demonstration of method rather than a diagnostic tool.
Can quantitative radiomic features extracted from segmented ovarian ultrasound images help distinguish the eight official MMOTU diagnostic categories?
This is a research demonstration and does not establish clinical validity or diagnostic utility.
Dataset
MMOTU is a public collection of ovarian ultrasound images, each labelled with one of eight diagnostic categories and paired with a segmentation mask. Some images had to be excluded because files were missing or broken. The categories are unbalanced: some have hundreds of images and others only a few dozen, which makes the rarer ones harder to learn.
MMOTU OTU_2d contains 1,469 labeled images in eight official categories. 1,269 images have usable image and segmentation-mask files; 200 observations were excluded because files or masks were missing or invalid. The label lists identify images by filename and do not provide reliable patient identifiers.
The table below shows the existing class distribution.
| labeled images | |
|---|---|
| chocolate cyst | 336 |
| serous cystadenoma | 219 |
| teratoma | 336 |
| theca cell tumor | 88 |
| simple cyst | 66 |
| normal ovary | 267 |
| mucinous cystadenoma | 104 |
| high-grade serous carcinoma | 53 |
| dataset summary | |
|---|---|
| labeled images | 1469 |
| usable images with masks | 1269 |
| excluded observations | 200 |
| reliable patient identifiers available | False |
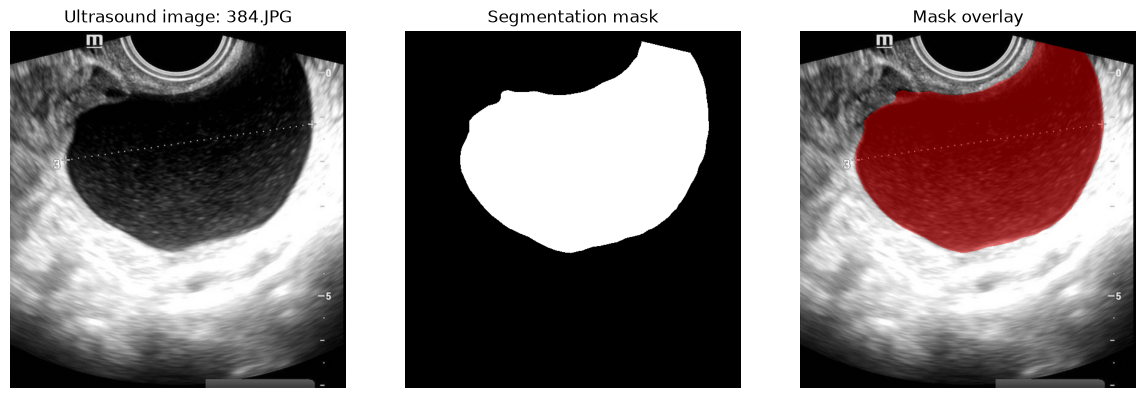
Example image and segmentation mask
Segmentation means outlining the lesion on the image. The resulting mask (white for the lesion, black for the background) tells the software exactly which pixels to analyse, so features describe the lesion rather than the surrounding tissue.
The mask defines the region of interest used for radiomic extraction. This example displays one existing image, its binary mask, and the mask overlay.
Radiomics extraction
PyRadiomics is a widely used open-source tool that computes standard radiomic features. First-order features describe the distribution of pixel brightness; texture features (GLCM, GLRLM) describe how brightness patterns repeat across the image; shape features describe the outline of the lesion. Without the physical size of each pixel, shape values are in pixels rather than millimetres.
PyRadiomics was applied to segmented ultrasound regions. The saved feature configuration contains 67 columns across first-order, GLCM, GLRLM, and 2D shape families. Physical pixel spacing is unavailable; shape values are in pixel units and have no physical interpretation.
This summary reads the recorded extractor configuration; it does not rerun feature extraction.
| saved radiomics configuration | |
|---|---|
| engine | PyRadiomics firstorder + GLCM + GLRLM + 2D shape |
| version | 3.1.0a2.post8+g6a761c4 |
| feature columns | 67 |
| feature families | firstorder, glcm, glrlm, shape2D |
| spacing | pixel units; physical spacing unavailable |
Leakage-safe preprocessing
Data leakage happens when information from test data slips into model building, making results look better than they are. To prevent it, every preparation step (filling missing values, removing uninformative features, scaling, selecting the most useful features) is learned on the training data only and then applied unchanged to the data used for testing.
The model pipeline uses imputation, variance filtering, scaling, and mutual-information feature selection. These steps are fit only on each training fold, then applied to that fold's validation data. No feature selection or preprocessing is fit on the held-out official validation partition.
Validation design
Validation is how a model’s performance is estimated on data it has not seen. Five-fold cross-validation splits the training data into five parts, each taking a turn as the test set. A separate official validation set is kept aside until the very end. Because the dataset has no patient identifiers, images from the same patient could appear in both training and testing, which limits how far results can be generalised.
Five-fold cross-validation was performed on the official training partition, with the official validation partition held out until final evaluation. The official validation partition was not used for tuning. The random seed was 42. A duplicate-grouped cross-validation was also performed as a robustness analysis.
No patient-level independence can be claimed because reliable patient identifiers are unavailable.
Model results
Four models are compared, including a “dummy” baseline that always guesses the most common class, the score any real model must beat. Accuracy is the share of correct predictions; macro F1 and balanced accuracy give each of the eight categories equal weight, so rare categories count as much as common ones. A large gap between training and validation scores is a sign of overfitting: the model memorises rather than learns.
The main CV table below reports the existing standard image-level CV results. The official validation metrics are shown separately. These are reported as model comparisons, not as clinical interpretations.
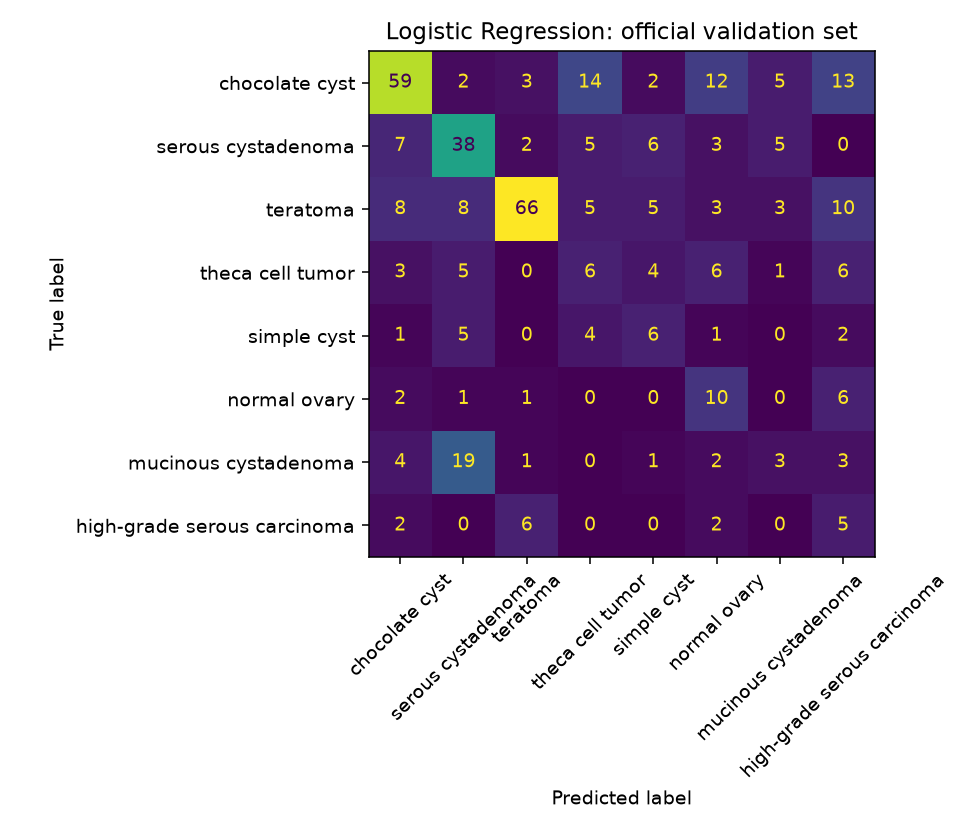
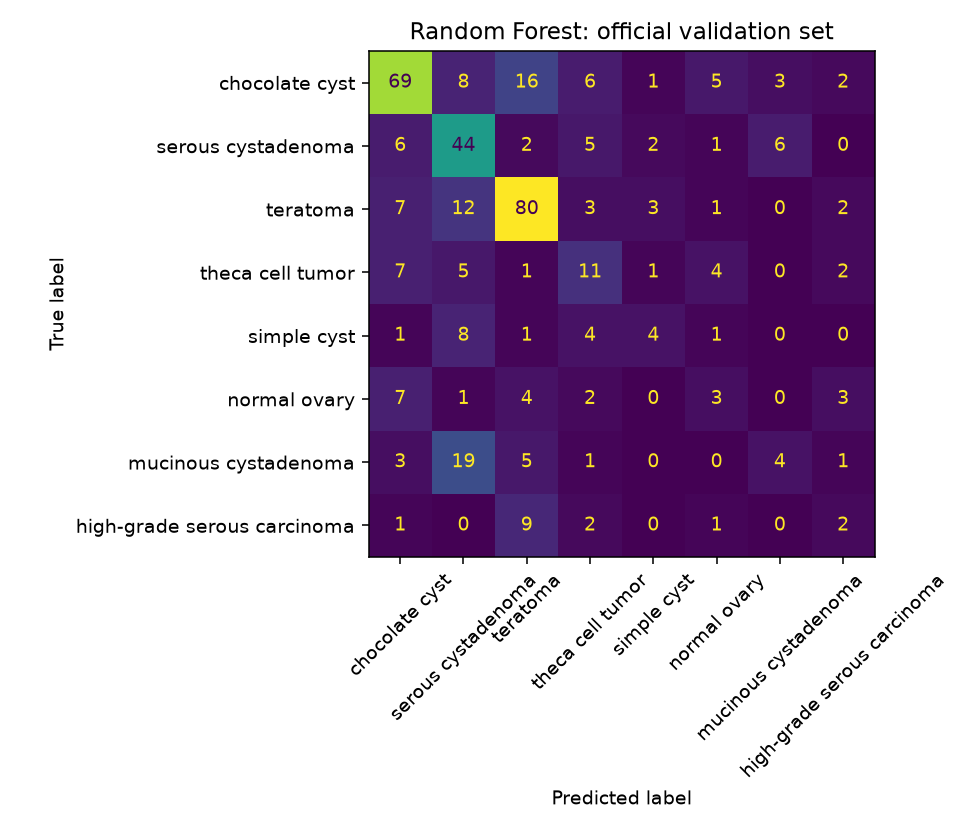
Logistic Regression has the smallest train–validation gap. Random Forest and XGBoost show larger gaps, consistent with greater overfitting; the more complex models achieve somewhat higher CV AUCs. Recall varies substantially across classes.
| Model | Accuracy mean | Accuracy SD | Macro F1 mean | Macro F1 SD | Balanced accuracy mean | Balanced accuracy SD | Train accuracy | Train–validation gap |
|---|---|---|---|---|---|---|---|---|
| Dummy | 0.263 | 0.003 | 0.052 | 0.000 | 0.125 | 0.000 | 0.263 | 0.000 |
| Logistic Regression | 0.478 | 0.047 | 0.367 | 0.050 | 0.396 | 0.050 | 0.504 | 0.027 |
| Random Forest | 0.549 | 0.053 | 0.394 | 0.078 | 0.388 | 0.067 | 0.976 | 0.427 |
| XGBoost | 0.535 | 0.033 | 0.314 | 0.044 | 0.322 | 0.033 | 0.787 | 0.252 |
| Model | Accuracy | Macro F1 | Balanced accuracy | Macro OVR AUC | Brier score | Log loss |
|---|---|---|---|---|---|---|
| Dummy | 0.269 | 0.053 | 0.125 | 0.500 | 0.808 | 1.826 |
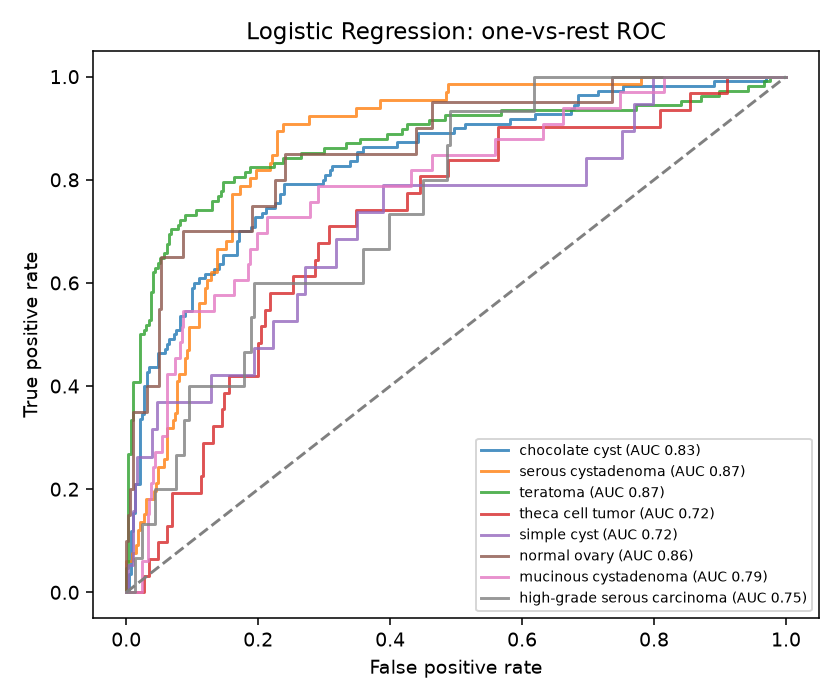
| Logistic Regression | 0.480 | 0.366 | 0.395 | 0.802 | 0.686 | 1.566 |
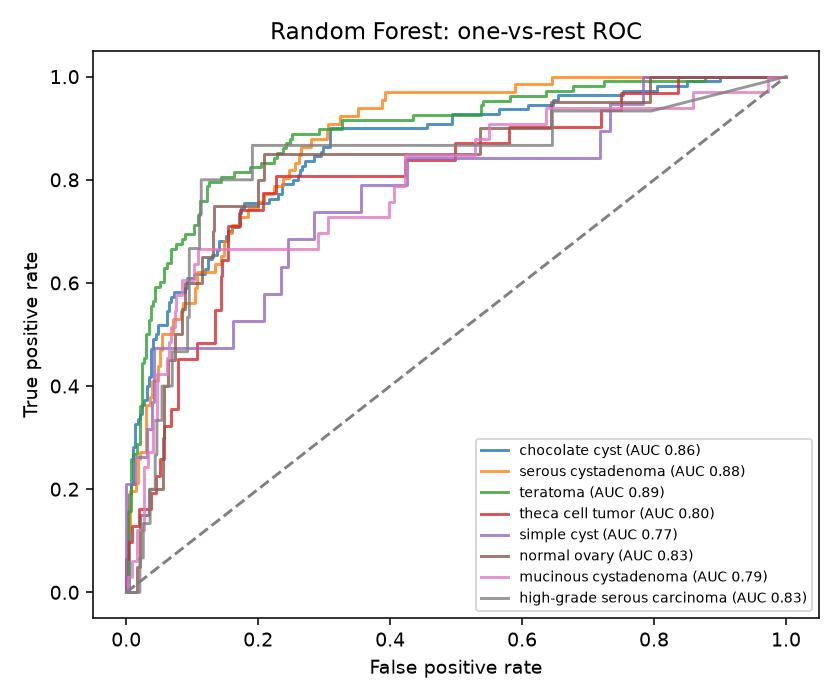
| Random Forest | 0.540 | 0.374 | 0.376 | 0.832 | 0.584 | 1.387 |
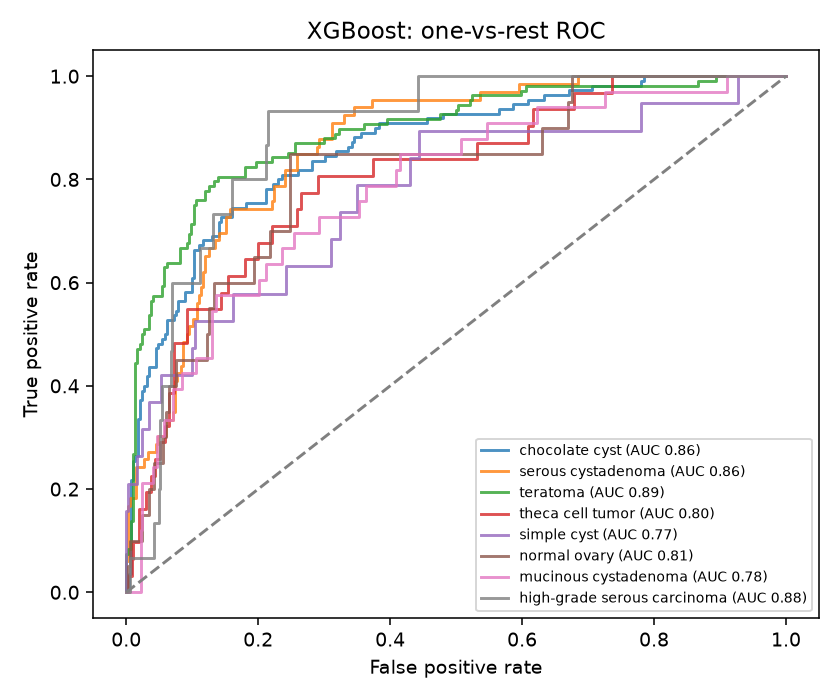
| XGBoost | 0.560 | 0.333 | 0.339 | 0.833 | 0.582 | 1.281 |
| Category | Dummy | Logistic Regression | Random Forest | XGBoost |
|---|---|---|---|---|
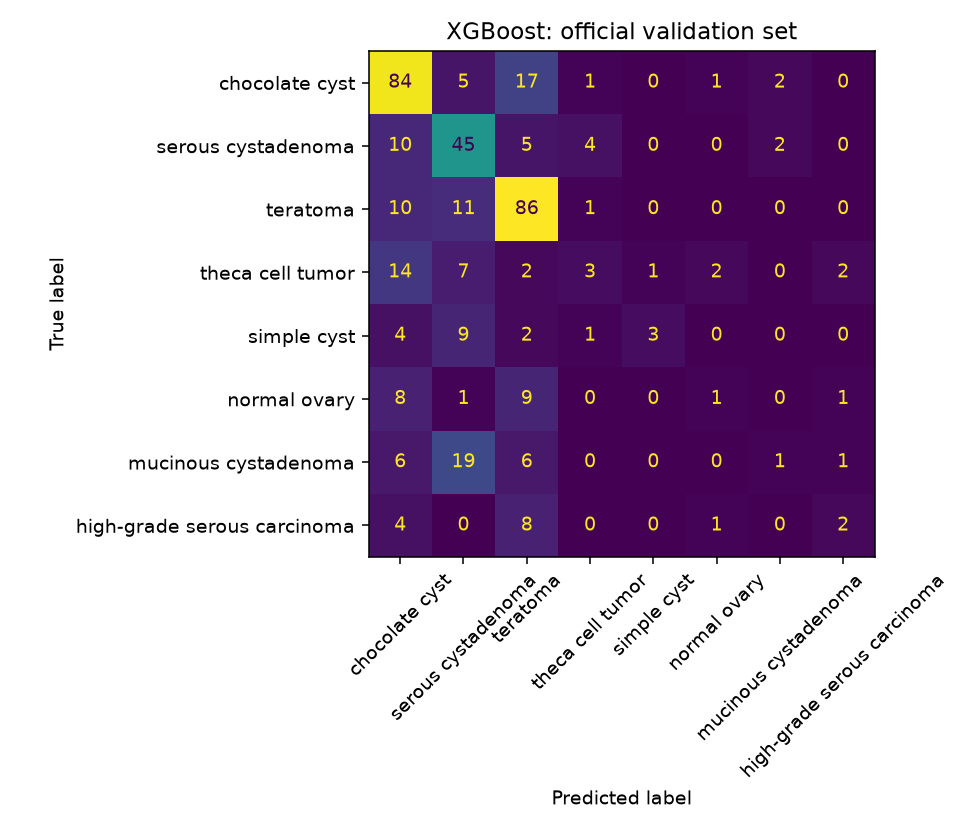
| chocolate cyst | 0.0 | 0.54 | 0.63 | 0.76 |
| serous cystadenoma | 0.0 | 0.58 | 0.67 | 0.68 |
| teratoma | 1.0 | 0.61 | 0.74 | 0.80 |
| theca cell tumor | 0.0 | 0.19 | 0.35 | 0.10 |
| simple cyst | 0.0 | 0.32 | 0.21 | 0.16 |
| normal ovary | 0.0 | 0.50 | 0.15 | 0.05 |
| mucinous cystadenoma | 0.0 | 0.09 | 0.12 | 0.03 |
| high-grade serous carcinoma | 0.0 | 0.33 | 0.13 | 0.13 |
Confusion matrices, ROC curves, and calibration
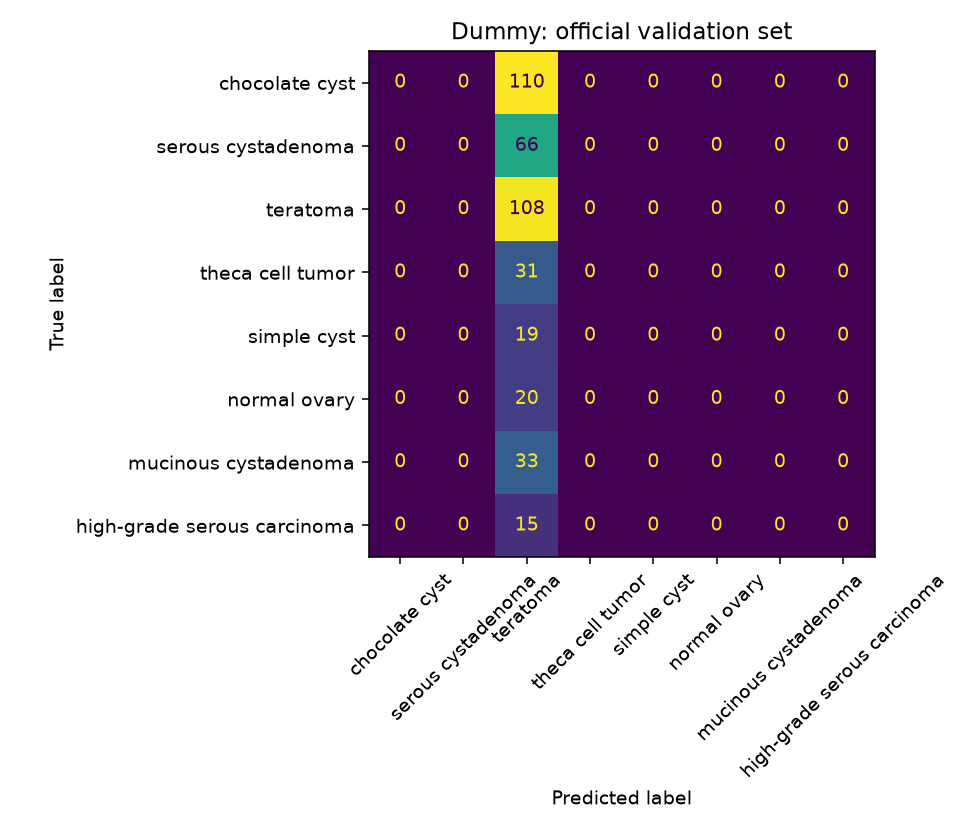
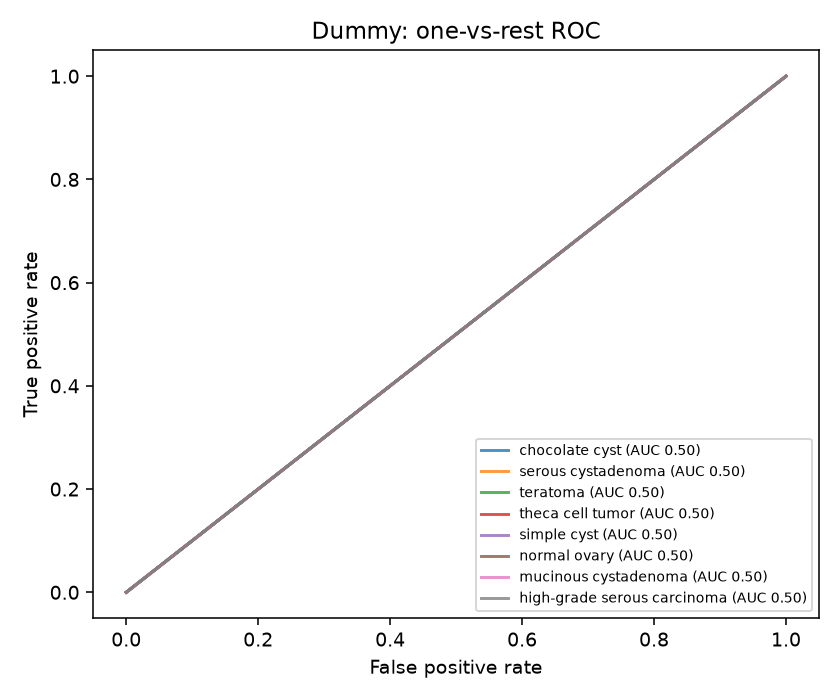
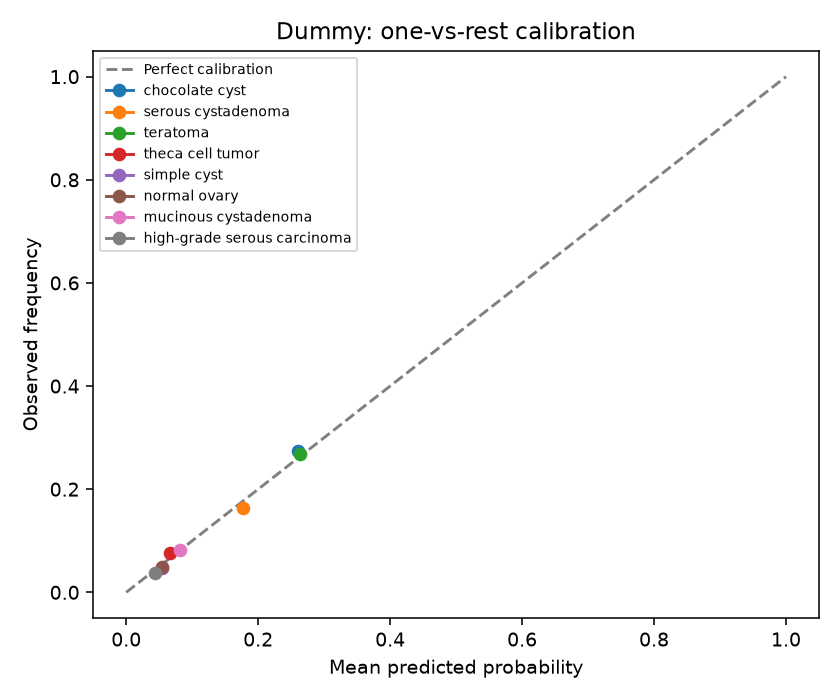
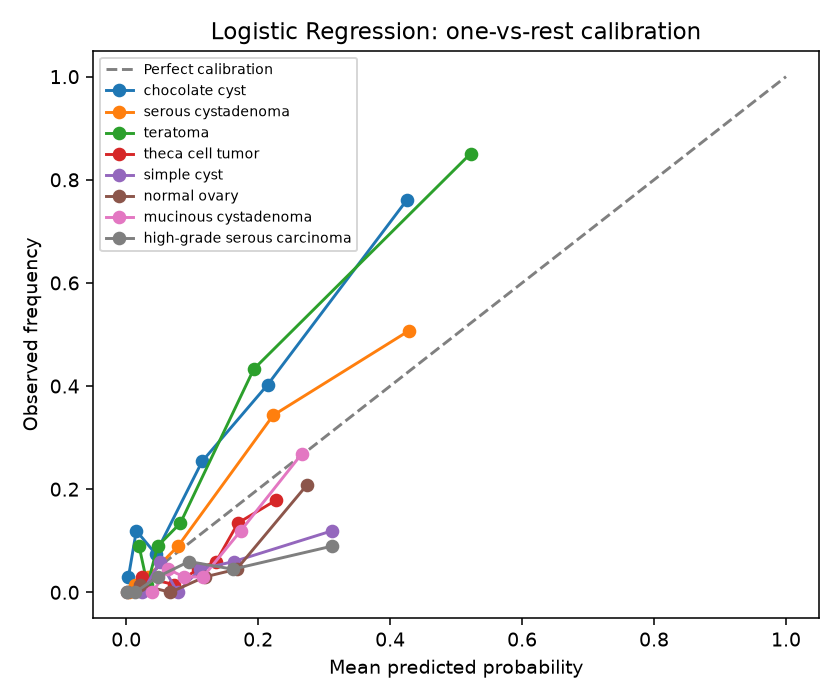
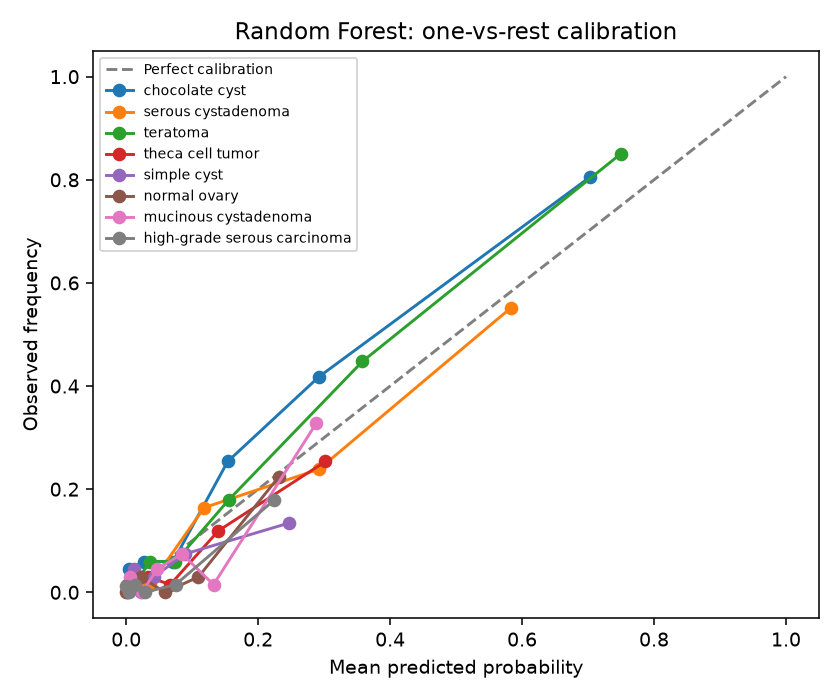
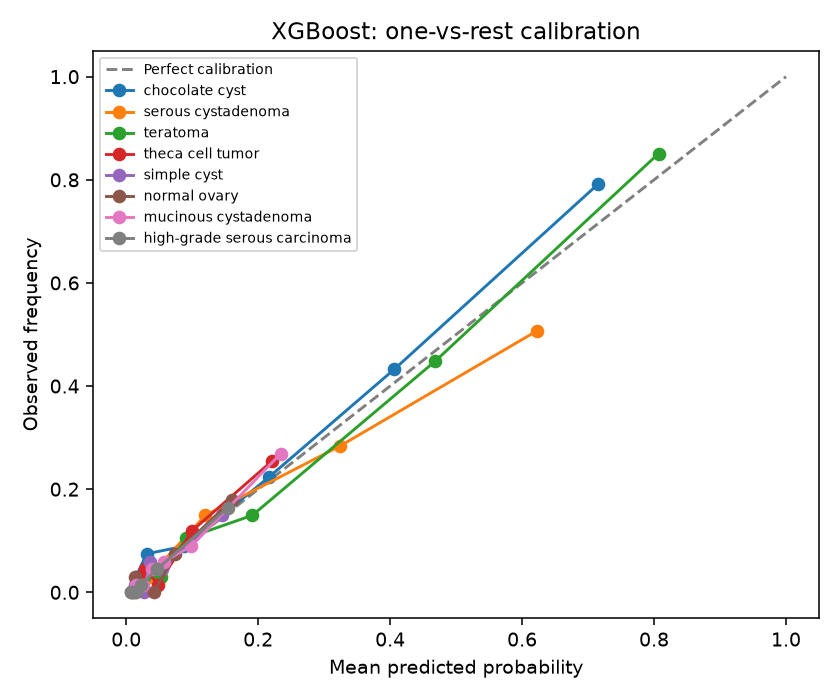
A confusion matrix shows, for each true category, how often the model predicted each category, making it clear which types get mixed up. ROC curves show the trade-off between catching a category and raising false alarms. Calibration checks whether predicted probabilities are honest: if the model says 70%, it should be right about 70% of the time.
These are the existing figures for the official validation partition. Recall varies substantially across the eight categories; calibration and discrimination summaries are also reported in the tables above.
Dummy baseline
Logistic Regression
Random Forest
XGBoost
Robustness checks
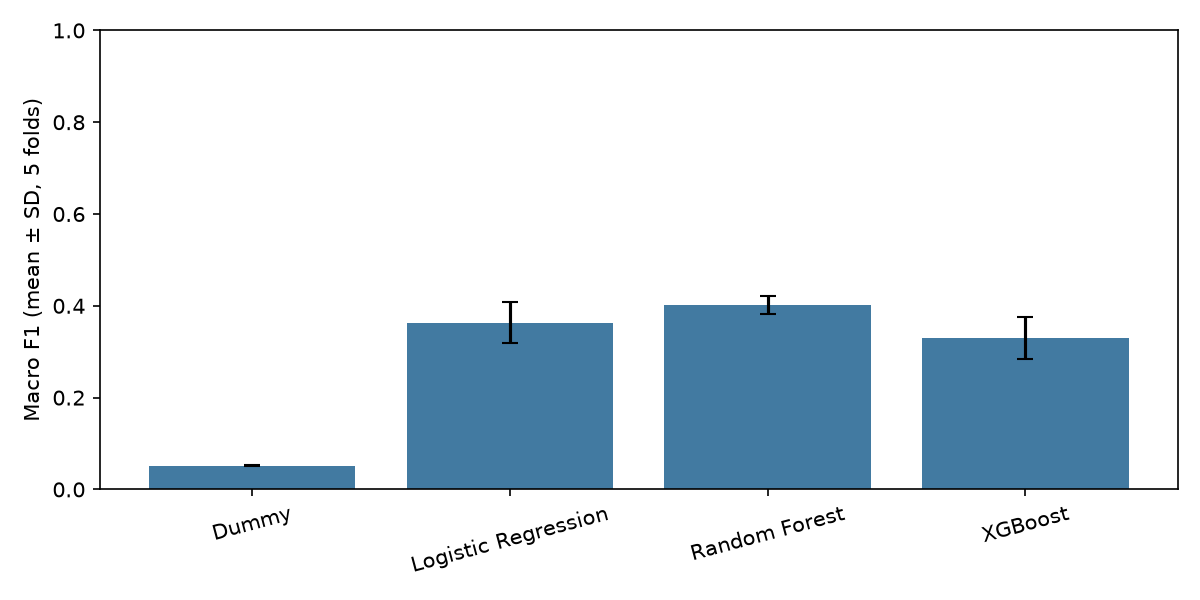
Robustness checks test whether results hold up when the analysis is done a slightly different way. Here the main concern is identical images appearing more than once: if a copy lands in both training and testing, the model is effectively tested on something it has already seen. Cross-validation was repeated keeping duplicates together to see whether scores changed.
The exact-duplicate audit found no duplicated modeling observations and no exact-duplicate groups crossing CV folds or the official train/validation boundary. Duplicate-grouped CV produced essentially unchanged results. The official validation set required no duplicate-based exclusions, and its metrics remained unchanged.
The existing macro-F1 chart summarizes duplicate-grouped CV by model. The table in the next section compares those values with standard image-level CV.
Exact duplicate image audit
The dataset contains many duplicated image files. The audit compares files byte by byte to find exact copies and checks that no copy is split across training and testing. This guards against a common and often overlooked source of inflated results in public imaging datasets.
The audit inspected 1,886 physical source files and identified 617 sets of duplicate physical source files. Each labeled modeling observation was used only once. Zero duplicate groups crossed CV folds or the official train/validation boundary. The table compares existing original and duplicate-grouped CV values; no new model fitting is performed here.
| exact duplicate audit | |
|---|---|
| physical source files inspected | 1886 |
| sets of duplicate physical source files | 617 |
| usable labeled modeling observations | 1269 |
| duplicate groups with multiple modeling observations | 0 |
| duplicate groups crossing original CV folds | 0 |
| duplicate groups crossing official train/validation boundary | 0 |
| validation images removed | 0 |
| validation images before and after cleaning | 402 / 402 |
| Model | Original accuracy | Grouped accuracy | Original macro F1 | Grouped macro F1 | Original balanced accuracy | Grouped balanced accuracy | Original OVR AUC | Grouped OVR AUC |
|---|---|---|---|---|---|---|---|---|
| Dummy | 0.263 | 0.263 | 0.052 | 0.052 | 0.125 | 0.125 | 0.500 | 0.500 |
| Logistic Regression | 0.478 | 0.480 | 0.367 | 0.364 | 0.396 | 0.395 | 0.778 | 0.786 |
| Random Forest | 0.549 | 0.552 | 0.394 | 0.402 | 0.388 | 0.397 | 0.801 | 0.812 |
| XGBoost | 0.535 | 0.537 | 0.314 | 0.330 | 0.322 | 0.334 | 0.804 | 0.806 |
| model | original_official_validation_accuracy | duplicate_clean_official_validation_accuracy | original_official_validation_macro_f1 | duplicate_clean_official_validation_macro_f1 | original_official_validation_balanced_accuracy | duplicate_clean_official_validation_balanced_accuracy | original_official_validation_macro_ovr_auc | duplicate_clean_official_validation_macro_ovr_auc |
|---|---|---|---|---|---|---|---|---|
| Dummy | 0.269 | 0.269 | 0.053 | 0.053 | 0.125 | 0.125 | 0.500 | 0.500 |
| Logistic Regression | 0.480 | 0.480 | 0.366 | 0.366 | 0.395 | 0.395 | 0.802 | 0.802 |
| Random Forest | 0.540 | 0.540 | 0.374 | 0.374 | 0.376 | 0.376 | 0.832 | 0.832 |
| XGBoost | 0.560 | 0.560 | 0.333 | 0.333 | 0.339 | 0.339 | 0.833 | 0.833 |
Methodological safeguards
This section lists the rules followed to keep the analysis honest: no information from test data used during training, a fixed random seed so results can be reproduced exactly, and no invented data such as patient identifiers, clinical variables or pixel sizes that the dataset does not provide.
- Imputation, variance filtering, scaling, and feature selection are fit within training folds.
- The held-out official validation partition is not used for tuning.
- Random seed = 42.
- No patient identifiers or clinical covariates are fabricated.
- No physical spacing is invented.
- The official eight-class labels are retained; no benign/malignant remapping is imposed.
Limitations
Every study has limits, and stating them clearly is part of the result. These define what the findings can and cannot support, and what would be needed, such as patient-level data or images from other hospitals, before any clinical claim could be made.
- No reliable patient identifiers are available.
- Patient-level independent validation cannot be claimed.
- The evidence comes from one public dataset and acquisition context.
- No external-center validation was performed.
- Physical pixel spacing is unavailable.
- Radiomic features may depend on annotation, display, and compression characteristics.
- The results do not establish clinical validity or diagnostic utility.
Conclusion
This closing section summarises what the experiment shows: a reproducible radiomics and machine-learning workflow, how the models compared, and what the checks for leakage and duplicates found. It should be read as a methodological demonstration, not as a validated diagnostic model.
This demonstration shows that a reproducible radiomics-to-ML workflow can be built on MMOTU ovarian ultrasound data, including leakage-aware preprocessing, model comparison, calibration, and robustness checks. More complex models achieved somewhat higher discrimination but also showed larger train–validation gaps. Exact duplicate leakage was investigated and did not materially affect performance. The experiment should be interpreted as a methodological demonstration rather than a clinically validated diagnostic model.